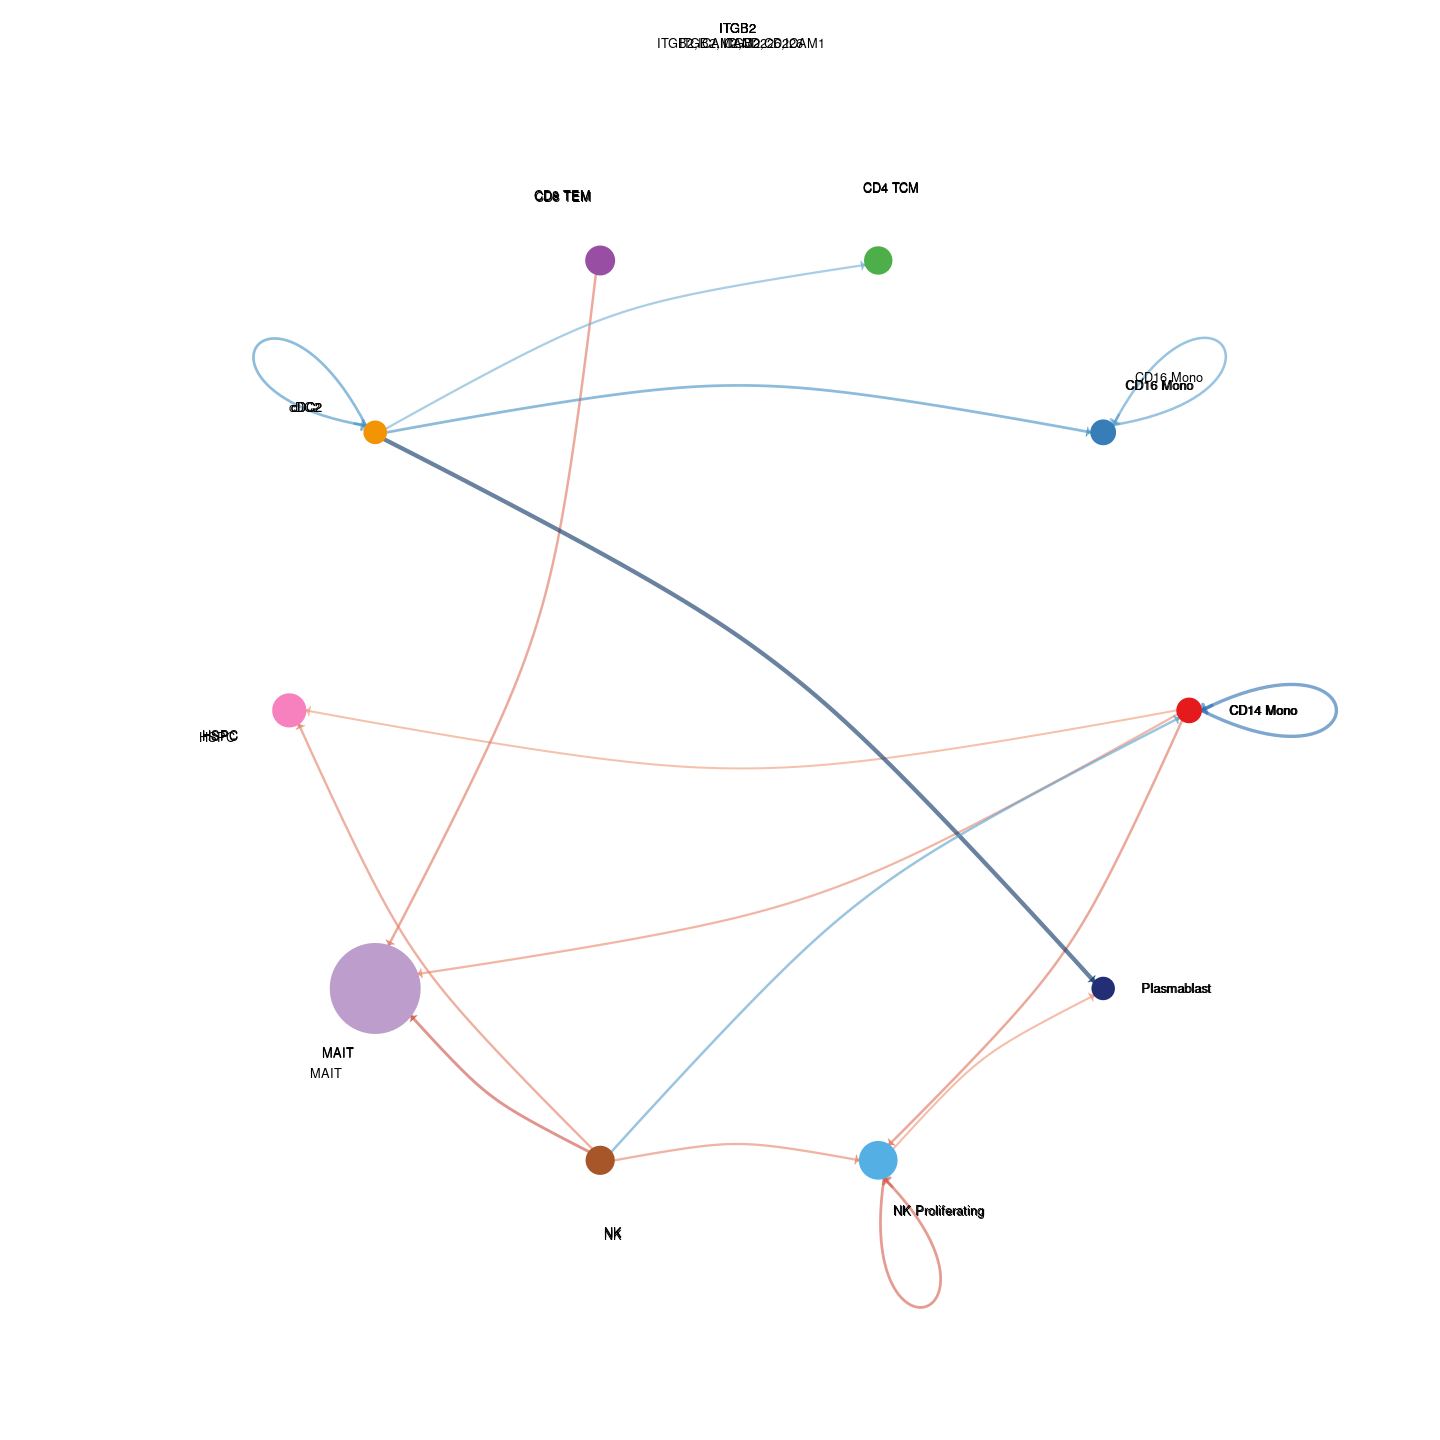
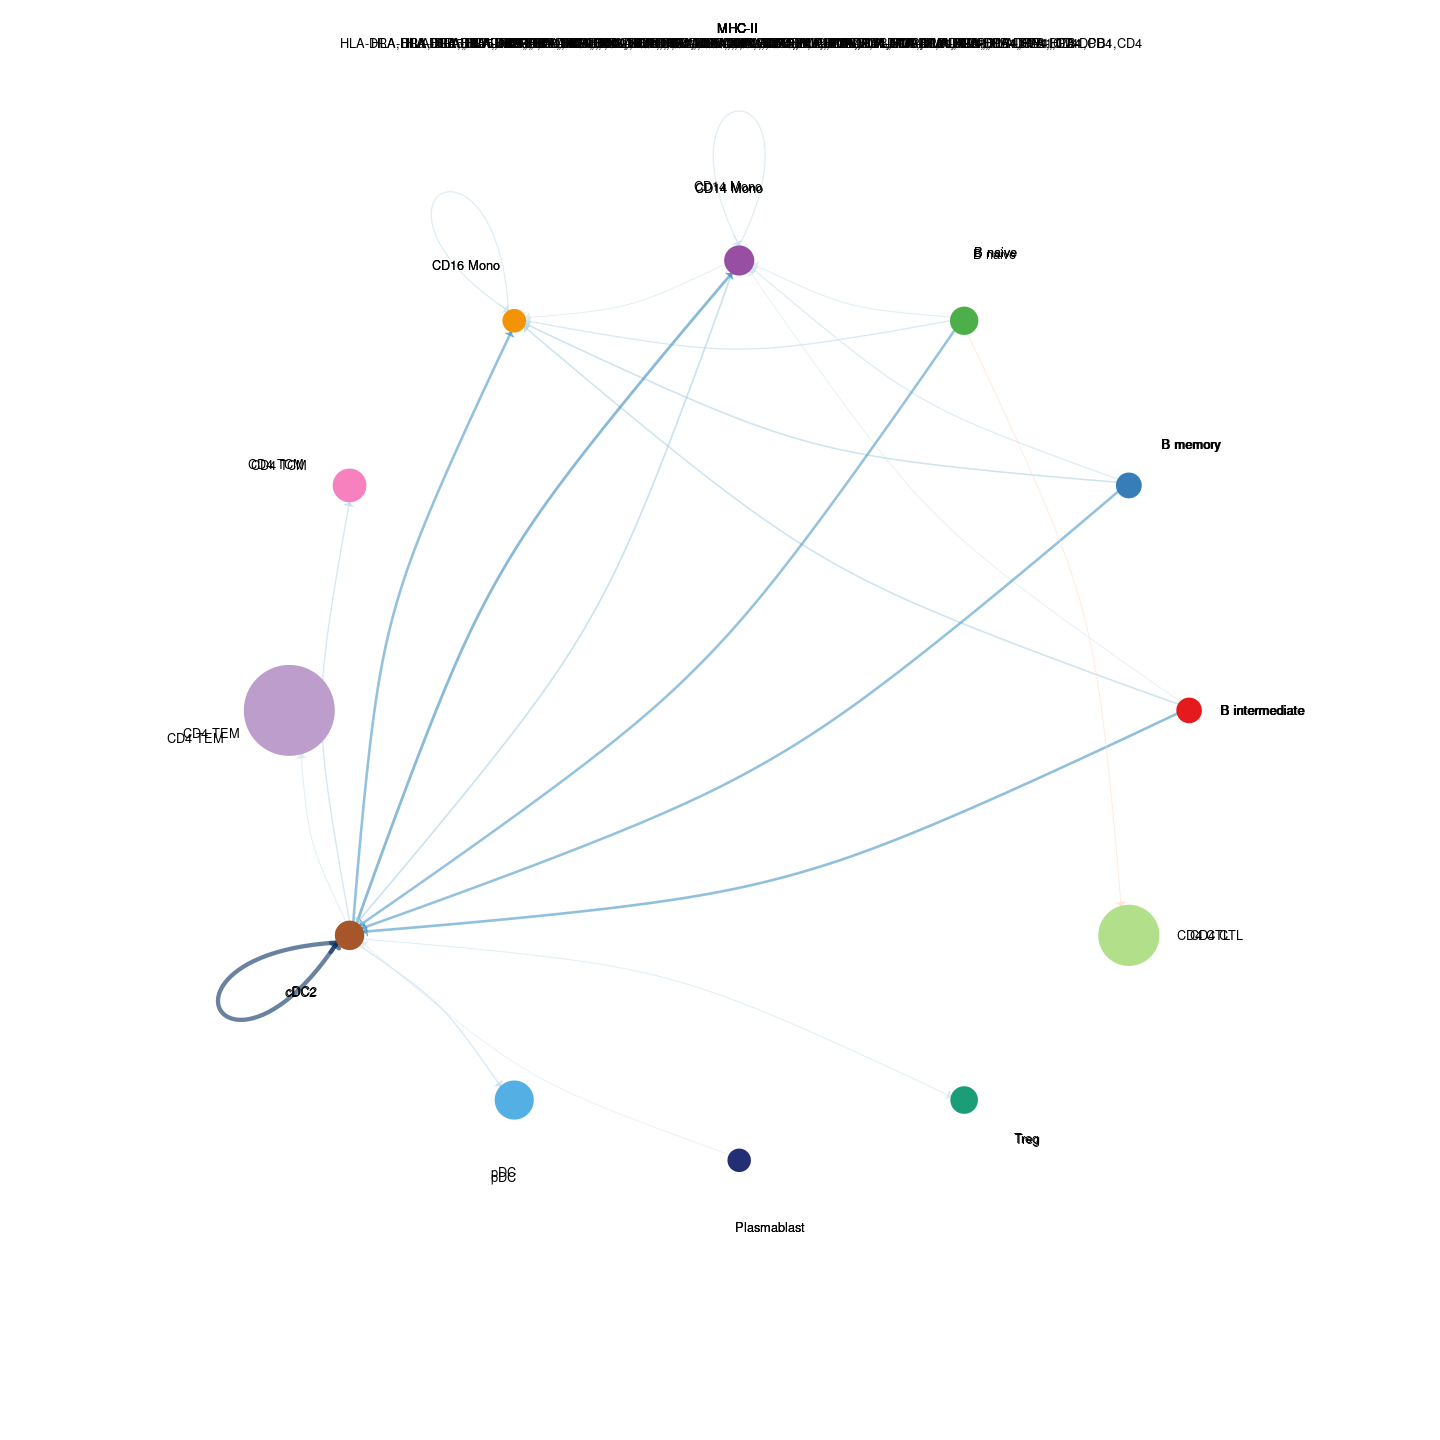
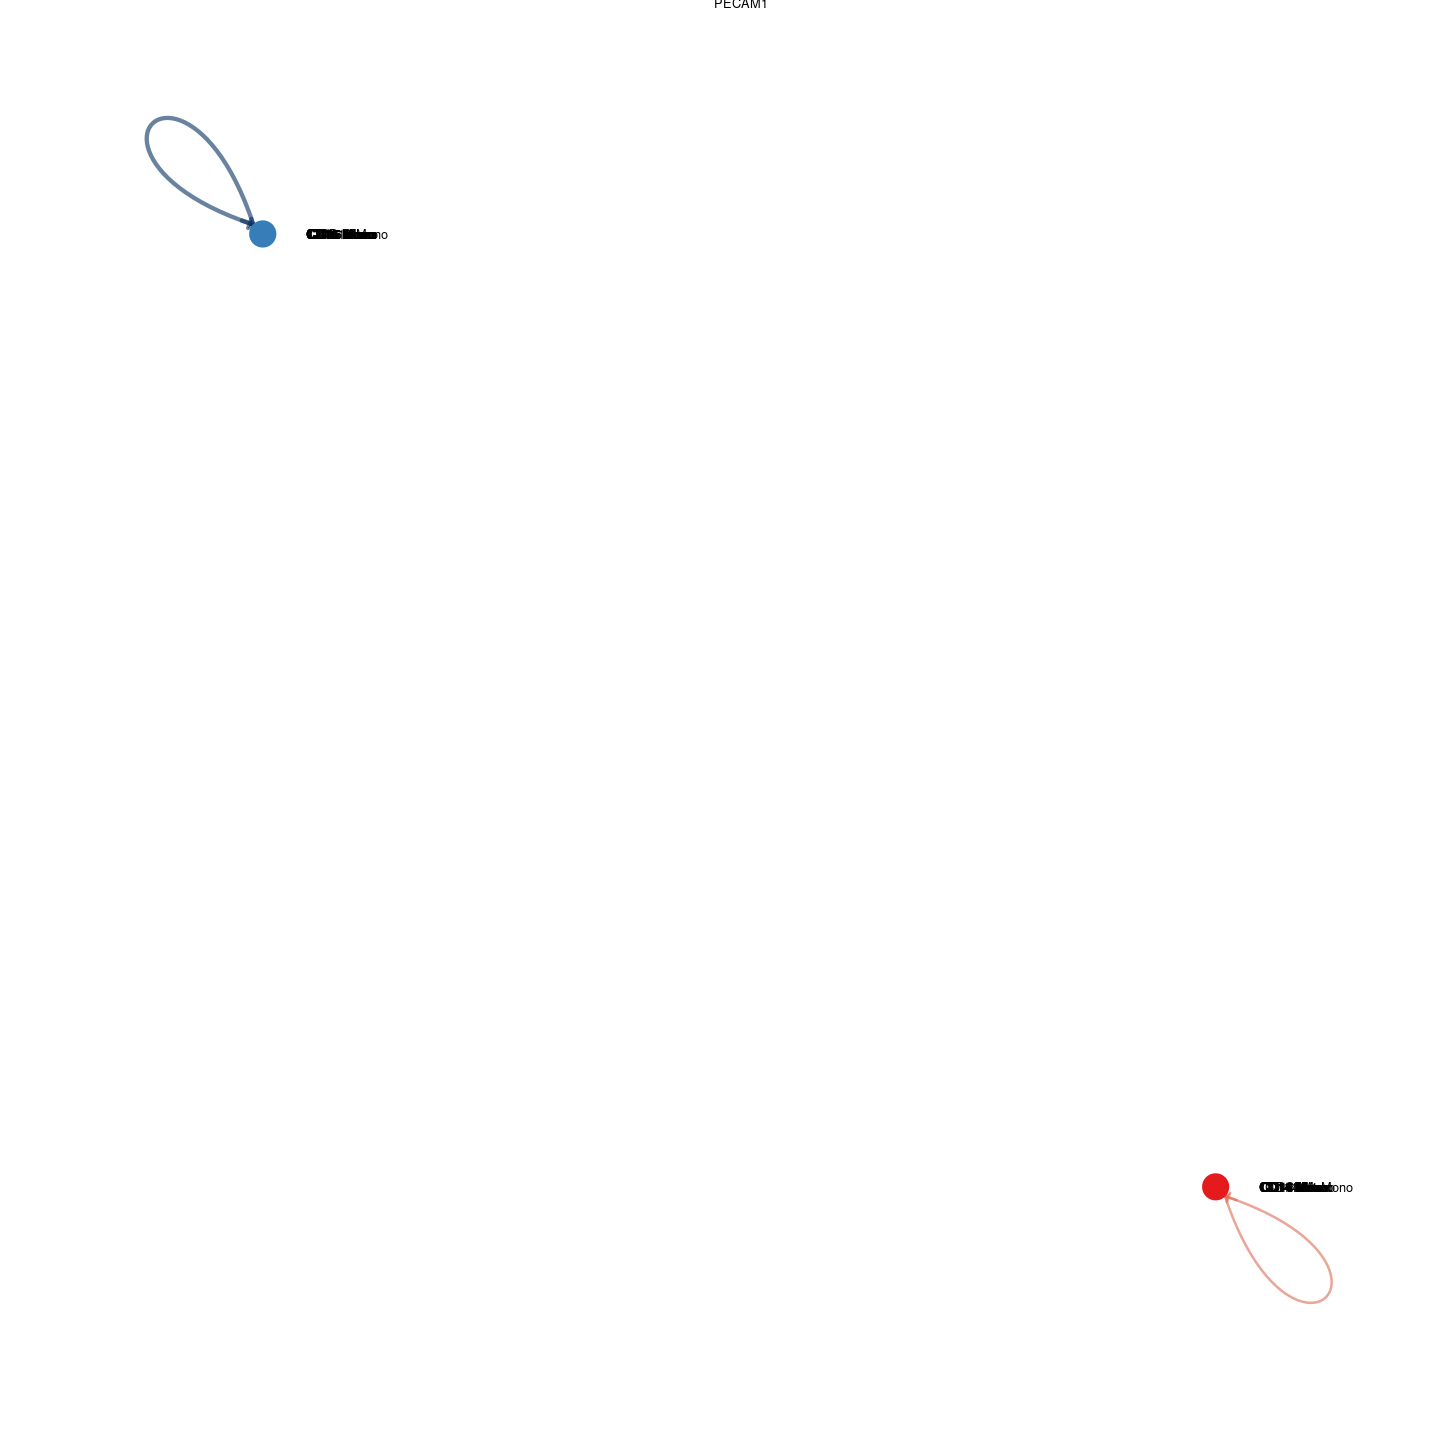
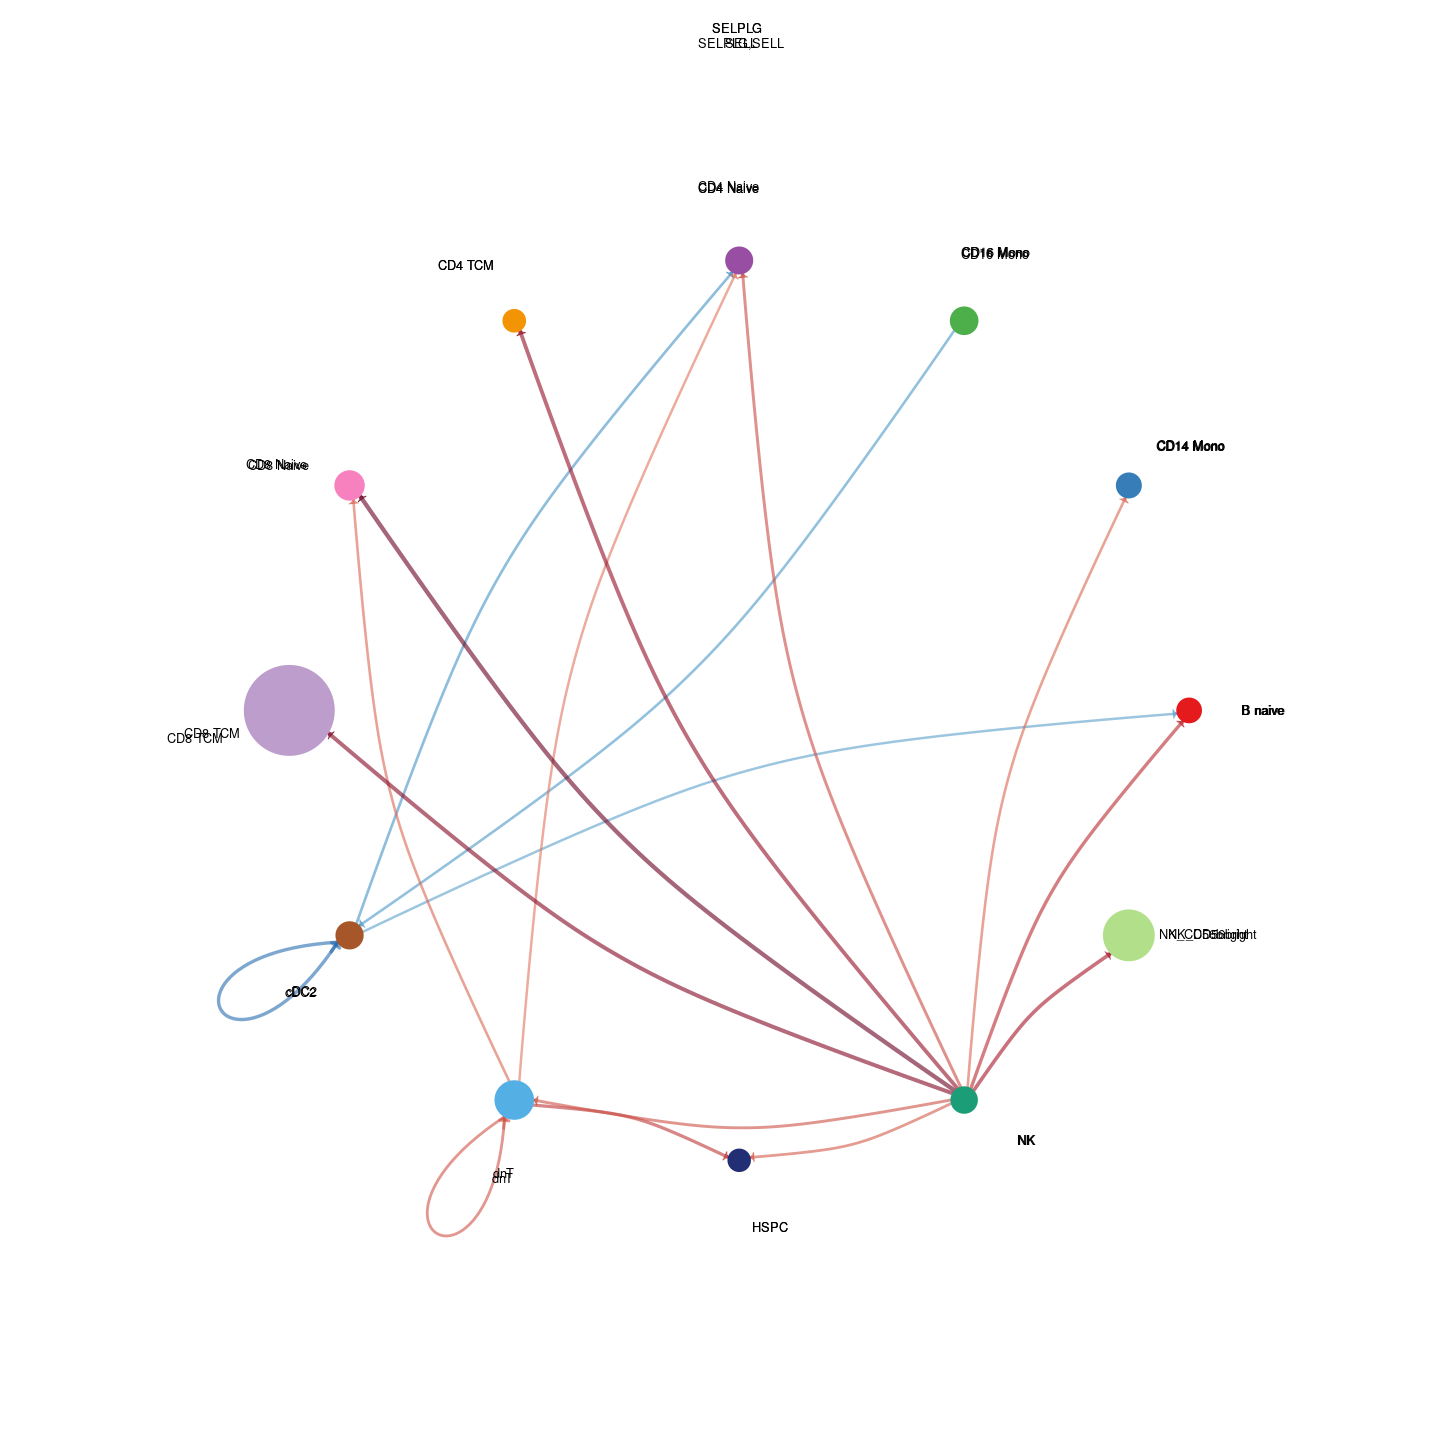
plot_communication_circle <- readRDS(here("data/3_prime_batch_1/fast_pipeline_results/communication/plot_communication_circle.rds"))

draw_cellchat_circle_plot = function (net, color.use = NULL, title.name = NULL, sources.use = NULL,
                                      targets.use = NULL, remove.isolate = FALSE, top = 1, top_absolute = NULL, weight.scale = T,
                                      vertex.weight = 20, vertex.weight.max = NULL, vertex.size.max = 15,
                                      vertex.label.cex = 0.8, vertex.label.color = "black", edge.weight.max = NULL,
                                      edge.width.max = 8, alpha.edge = 0.6, label.edge = FALSE,
                                      edge.label.color = "black", edge.label.cex = 0.8, edge.curved = 0.2,
                                      shape = "circle", layout = in_circle(), margin = 0.2, vertex.size = NULL,
                                      arrow.width = 1, arrow.size = 0.2)
{
  if (!is.null(vertex.size)) {
    warning("'vertex.size' is deprecated. Use `vertex.weight`")
  }
  options(warn = -1)

  if(!is.null(top_absolute)) {
    thresh = top_absolute
    net[abs(net) < thresh] <- 0
  }

  thresh <- stats::quantile(as.numeric(net) %>% abs %>% .[.>0], probs = 1 - top)

  net[abs(net) < thresh] <- 0

  if(sum(net)==0) return(NULL)

  if ((!is.null(sources.use)) | (!is.null(targets.use))) {
    if (is.null(rownames(net))) {
      stop("The input weighted matrix should have rownames!")
    }
    cells.level <- rownames(net)
    df.net <- reshape2::melt(net, value.name = "value")
    colnames(df.net)[1:2] <- c("source", "target")
    if (!is.null(sources.use)) {
      if (is.numeric(sources.use)) {
        sources.use <- cells.level[sources.use]
      }
      df.net <- subset(df.net, source %in% sources.use)
    }
    if (!is.null(targets.use)) {
      if (is.numeric(targets.use)) {
        targets.use <- cells.level[targets.use]
      }
      df.net <- subset(df.net, target %in% targets.use)
    }
    df.net$source <- factor(df.net$source, levels = cells.level)
    df.net$target <- factor(df.net$target, levels = cells.level)
    df.net$value[is.na(df.net$value)] <- 0
    net <- tapply(df.net[["value"]], list(df.net[["source"]],
                                          df.net[["target"]]), sum)
  }
  net[is.na(net)] <- 0
  if (remove.isolate) {
    idx1 <- which(Matrix::rowSums(net) == 0)
    idx2 <- which(Matrix::colSums(net) == 0)
    idx <- intersect(idx1, idx2)
    if(length(idx)>0){
      net <- net[-idx, ,drop=FALSE]
      net <- net[, -idx, drop=FALSE]
    }
  }
  g <- graph_from_adjacency_matrix(net, mode = "directed",
                                   weighted = T)
  edge.start <- igraph::ends(g, es = igraph::E(g), names = FALSE)
  coords <- layout_(g, layout)
  if (nrow(coords) != 1) {
    coords_scale = scale(coords)
  }
  else {
    coords_scale <- coords
  }
  if (is.null(color.use)) {
    color.use = scPalette(length(igraph::V(g)))
  }
  if (is.null(vertex.weight.max)) {
    vertex.weight.max <- max(vertex.weight)
  }
  vertex.weight <- vertex.weight/vertex.weight.max * vertex.size.max +
    5
  loop.angle <- ifelse(coords_scale[igraph::V(g), 1] > 0, -atan(coords_scale[igraph::V(g),
                                                                             2]/coords_scale[igraph::V(g), 1]), pi - atan(coords_scale[igraph::V(g),
                                                                                                                                       2]/coords_scale[igraph::V(g), 1]))
  igraph::V(g)$size <- vertex.weight
  igraph::V(g)$color <- color.use[igraph::V(g)]
  igraph::V(g)$frame.color <- color.use[igraph::V(g)]
  igraph::V(g)$label.color <- vertex.label.color
  igraph::V(g)$label.cex <- vertex.label.cex
  if (label.edge) {
    igraph::E(g)$label <- igraph::E(g)$weight
    igraph::E(g)$label <- round(igraph::E(g)$label, digits = 1)
  }
  if (is.null(edge.weight.max)) {
    edge.weight.max <- max(abs(igraph::E(g)$weight))
  }
  if (weight.scale == TRUE) {
    igraph::E(g)$width <- 0.3 + abs(igraph::E(g)$weight)/edge.weight.max *
      edge.width.max
  }
  else {
    igraph::E(g)$width <- 0.3 + edge.width.max * abs(igraph::E(g)$weight)
  }
  igraph::E(g)$arrow.width <- arrow.width
  igraph::E(g)$arrow.size <- arrow.size
  igraph::E(g)$label.color <- edge.label.color
  igraph::E(g)$label.cex <- edge.label.cex

  igraph::E(g)$color =
    circlize::colorRamp2(seq(max(abs(igraph::E(g)$weight)), -max(abs(igraph::E(g)$weight)), length.out =11), RColorBrewer::brewer.pal(11, "RdBu"))(igraph::E(g)$weight) %>%
    grDevices::adjustcolor(alpha.edge)


  if (sum(edge.start[, 2] == edge.start[, 1]) != 0) {
    igraph::E(g)$loop.angle[which(edge.start[, 2] == edge.start[,
                                                                1])] <- loop.angle[edge.start[which(edge.start[,
                                                                                                               2] == edge.start[, 1]), 1]]
  }
  radian.rescale <- function(x, start = 0, direction = 1) {
    c.rotate <- function(x) (x + start)%%(2 * pi) * direction
    c.rotate(scales::rescale(x, c(0, 2 * pi), range(x)))
  }
  label.locs <- radian.rescale(x = 1:length(igraph::V(g)),
                               direction = -1, start = 0)
  label.dist <- vertex.weight/max(vertex.weight) + 2
  plot(g, edge.curved = edge.curved, vertex.shape = shape,
       layout = coords_scale, margin = margin, vertex.label.dist = label.dist,
       vertex.label.degree = label.locs, vertex.label.family = "Helvetica",
       edge.label.family = "Helvetica")
  if (!is.null(title.name)) {
    text(0, 1.5, title.name, cex = 0.8)
  }
  gg <- recordPlot()
  return(gg)
}

plot_communication_circle =
  plot_communication_circle |>
  mutate(circle_plot = pmap(
    list(plot_diff, line_weights_sum_sum, gene, genes_in_pathway, plot_diff_quant),
    ~ {print(".");

        draw_cellchat_circle_plot(
        ..1,
        vertex.weight = ..2,
        title.name =  paste(..3, "\n", ..4),
        edge.width.max = 4,
        remove.isolate = TRUE,
        top_absolute=..5,
        top = 0.2,
        arrow.width = 4
      )
    }
  ))

## [1] "."


